An overview of population trends in the Nordic countries since the Second World War
The Nordic countries have seen a number of important changes to their populations since the end of World War II. Perhaps most notable among these are growth, increased diversity, and gradual aging. Labour migration has also played a role and detailed people registers mean that research of all kinds can be undertaken with accessible and wide-ranging data on the Nordic populations.

In the decades following the end of the Second World War, a number of important patterns of change emerged to define the demographic development of the region.
-
First, the overall population growth characteristic of earlier decades continued. The rates of growth, however, were slower and, to a significant degree, were dependent on immigration, especially in Sweden.
-
Second was the remarkable increase in the diversity of populations in terms of ethnicity, national origins, and religion. This was driven by Nordic, European, EU, and global population mobility that involved labor migration, economic and political differences, civil war, ethnic cleansing, famine, and a host of other push factors.
-
Third was an overall gradual aging pattern. One factor in this was that birthrates were generally low – although offset to a degree by high birth rates among some immigrant populations. At the same time, life expectancy increased throughout the region.
-
Fourth was extensive population mobility. This involved a number of aspects, including the continued decline of rural populations and growth of urban concentrations and the flow of people across the region facilitated by the same factors that caused increased diversity.
All of these developments have had both positive and negative impacts.
Population from 1950 to 2018 (Sources: see under Links below)
| Denmark | Faroe Islands | Greenland | Finland | Iceland | Norway | Sweden | Åland | |
|---|---|---|---|---|---|---|---|---|
| 1950 | 4,252,000 | 32,000 | 23,642(1951) | 4,030,000 | 144,000 | 3,250,000 | 7,042,000 | |
| 2018 | 5,781,190 | 50,498 | 55,877 | 5,513,130 | 348,450 | 5,296,619 | 10,120,242 | 1 359 |
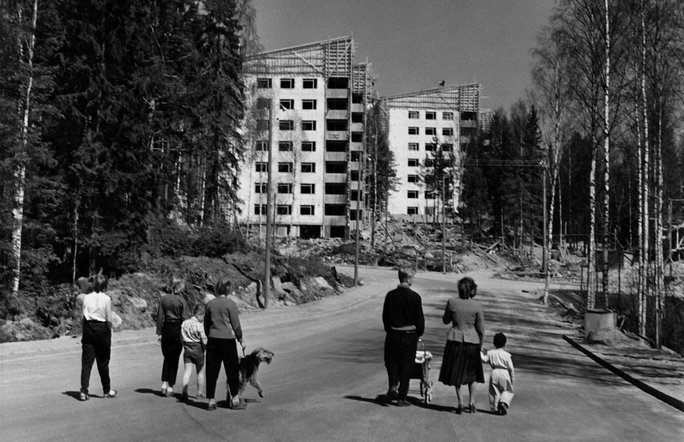
People of all ages walking near Helsinki, Finland in 1957, where in the background new housing is under construction. Photo:Racz Istvan, finna.fi (Helsingfors stadsmuseum). CC-BY-4.0.
Labour migration in the Nordic countries
The movement of labour, skilled and unskilled, both into and out of the Nordic region has been part of the larger history of population mobility for centuries. Its causes have varied widely, as have the rates of such mobility and the composition of the populations either leaving or entering the region. In some cases labor in-migration by particular groups has been encouraged by government policies or programs. More often, however, it appears to have been one element in the causal equation driving migration in general.
 In the decades following the Second World War, the Nordic countries saw varying rates of labour in-migration and labour out-migration – with the former being more complex and involving far great numbers. Overall, labour in-migration has been fueled by at least five factors including: open labour market policies adopted in the 1950s for Nordic country residents, early European integration labour policies, EU and EEA membership, EU expansion in the 21st century, specialized labour demands such as those in oil extraction or technology, striking economic imbalances between rich and poor nations such as those between the older members of the EU and the post-1991 joiners, and political and civil unrest and crises – especially in the Balkans, Middle East, Africa, and SE Asia. Some of this migration developed as permanent immigration; some was short term.
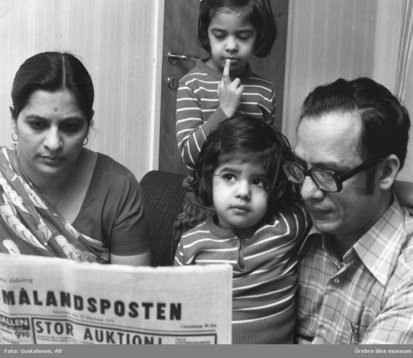
PICTURE: Family reading a Swedish newspaper in 1973. Photo by Alf Gustafsson retrieved from digitaltmuseum.se (Örebro läns museum). CC-BY-NC.
Today’s labour market is more global than at any other time in history, and Nordic countries are participants in that market. In the early decades following the Second World War most of this movement was among the Nordic countries, fed largely by economic development patterns. For a time Sweden was the most popular target country, and in the late 1990s there were about 220,000 foreign-born workers in Sweden; 90,000 of them were from other Nordic countries, over half of whom were Finns. The demographic characteristics of migrant populations changed in the last years of the 20th and early decades of the 21st centuries. Most obvious was that an increasingly percentage of migrants came from outside the Nordic region. In terms of percentage of the total population, Norway became the leading receiver of in-migrants, followed by Denmark, Sweden, and Finland. In Denmark, Finland, and Norway the largest groups were from either OECD countries or from new countries in the EU. In Sweden asylum seekers made up the largest group.
Almost all migration has impacts upon the labour market, and this has certainly been true in the Nordic region. Relatively unproblematic has been the movement of Nordic and EU professionals and others with in-demand job skills. Significant challenges exist at the less- skilled and un-skilled ends of the job market. It is there that many labour migrants are more likely to compete with existing more vulnerable populations, complicate job-training programs, and amplify unemployment figures, which in turn can contribute to rising tensions between these two groups. On the positive side, some labour migration is seen as important to offset the decline of native-born working-age populations.
Diverse, illustrative population statistics (Various sources: see Links below)
| Denmark | Finland | Iceland | Norway | Sweden | |
|---|---|---|---|---|---|
| Male life expectancy (2018) | 79.3 | 78.7 | 81 | 80.6 | 80.6 |
| Female life expectancy (2018) | 83.2 | 84.2 | 84 | 84.3 | 84.1 |
| Birthrate (2016) | 1.8 | 1.65 | 1.8 | 1.7 | 1.9 |
| % foreign born (2016) | c.11 | 7.1 | 15.7 | 16.8 | 19.1 |
| Emigration (2018) | 68,645 | 19,148 | 7,719 | 34,382 | 45,294 |
| Immigration (2018) | 87,329 | 31,106 | 14,275 | 52,485 | 101,171 |
| Asylum seekers (2018) | c.2,000 | c.4,500 | 800 | 2,655 | 21,502 |
Access to unparalleled data due to history and people registers
Demographic research in the Nordic countries is aided by uniquely rich records. Beginning in the Middle Ages, but more so since the Reformation, the clergy of the region have kept detailed information that, at best, covered names, births, baptisms, confirmations, marriages, deaths, the movement of people into and out of the parishes, and even literacy. The information was gathered during visits by local clergy to the homes of their parishioners (husförhörslängder in Sweden) and kept in parish registers. At the same time, central governments mandated and local officials collected information about male populations, landownership, natural resources, and taxes. Beginning with Sweden and Finland in 1750 and with Denmark-Norway-Iceland in 1769, periodic national censuses have also been conducted. Although the quality of all these records varied widely, they were the bases for inventories of the region’s human and material assets and potential, and its collection was an aspect of early modern state development.
Today the churches have been replaced by central statistical records offices. Every resident of a Nordic country has a personal number, and information about every person is regularly being updated and maintained in central population registers. All of this information is invaluable to scholars and researchers in many fields. A great deal of it is available online, including, for example, many of the original parish registers.
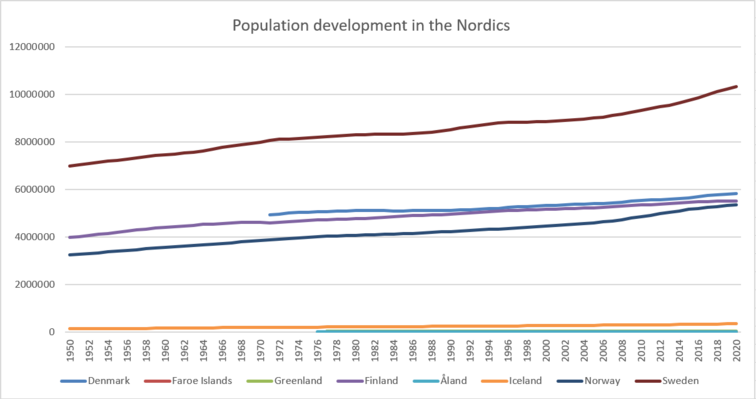
GRAPH: Population development in Norden 1950-2020. Source: Nordic Statistics database
Further reading:
- Andreas Ekeland et al. Migration between the Nordic Countries: What do register data tell us about the knowledge flows?, Oslo: STEP Centre for Innovation Research Report 10-2003, SINTEF Industrial Management (2003).
- Giang Ho and Kazuko Shirono, The Nordic Labor Market and Migration, International Monetary Fund Publications (International Monetary Fund, 2015).


